How to Solve Assignments on Experimental Design and Data Analysis

Claim Your Discount Today
Celebrate the Christmas season with 15% OFF on all Statistics Homework Help at www.statisticshomeworkhelper.com ! 🎓 Let our expert statisticians handle your assignments with accurate solutions, clear explanations, and on-time delivery—so you can relax and enjoy the holidays without academic stress. 🎁 Use Christmas Offer Code: SHHRXMAS15 and make this festive season both joyful and productive!
We Accept


- Understanding the Assignment Structure
- 1. Preliminary Descriptive Analyses and Data Checks
- 2. Conducting the Statistical Analysis
- a) Testing Data Reliability for Inferential Use
- b) Testing Random Assignment
- c) Exploring the Relationship Between Anxiety and Achievement
- d) Measuring Teacher Effectiveness
- 3. Evaluating Significance and Meaningfulness
- Statistical Significance
- Practical Significance
- Validity and Reliability Checks
- Cross-validation
- 4. Writing APA-Style Conclusions for Clients
- Special Considerations in Educational Statistics
- Hierarchical Data
- Small Sample Sizes
- Ethical Use of Data
- Benefits and Challenges of Educational Data Evaluation
- Benefits:
- Challenges:
- Conclusion
Understanding how to approach educational statistics assignments through a purely theoretical lens can significantly enhance your problem-solving skills, especially when the tasks mirror real-life academic and institutional settings. Whether you're tasked with evaluating teacher effectiveness, checking the randomness of student groupings, or assessing the impact of math anxiety on performance, it's essential to ground your solutions in strong conceptual frameworks. This is where statistics homework help becomes a valuable academic asset, allowing students to navigate complex problems with clarity and precision. Assignments that involve designing experiments, interpreting classroom data, or performing multilevel analyses can be daunting without a solid grasp of statistical reasoning, and it’s this very challenge that this theoretical approach addresses. From conducting preliminary descriptive analyses to ensuring the reliability of data for inferential statistics, every stage demands a meticulous understanding of how to handle educational datasets ethically and effectively. You will often work with variables like performance scores, anxiety ratings, and classroom groupings—each of which requires specific techniques like regression, ANOVA, or even multilevel modeling. Notably, these assignments are not just about running tests; they involve evaluating the meaningfulness of findings through effect sizes, cross-validation, and narrative conclusion writing, typically in APA format. When paired with professional guidance or support systems that offer help with data analysis homework, students can learn how to validate assumptions, handle missing data appropriately, and assess the implications of their results for educational improvement. In essence, solving such assignments goes far beyond software execution—it’s about interpreting the numbers within an educational context, defending methodological choices, and communicating results in a way that informs real-world decisions. A theoretically grounded approach to these assignments equips you with the tools to assess both statistical and practical significance, ensuring that your conclusions are not only accurate but actionable. Furthermore, these insights have ethical implications, especially when used to make decisions about student learning paths or teacher recognition, reinforcing the need for thoughtful analysis and transparent reporting. By mastering this process, you don't just complete a homework task—you build a skillset that applies directly to educational research, policy development, and instructional improvement. This blog is your comprehensive guide to navigating these theoretical demands with clarity, showing how a structured, informed approach to educational data can elevate your academic work and professional preparedness in the field of applied statistics.
Understanding the Assignment Structure

Educational statistics assignments typically follow a consistent structure that mimics real-world scenarios in academic settings. They often begin with preliminary data checks, followed by conducting appropriate statistical analyses, interpreting the significance and meaningfulness of results, and finally writing a client-ready conclusion in APA format. Each component plays a crucial role in developing a complete understanding of the data, ensuring accurate interpretation, and delivering well-supported recommendations. These assignments not only test statistical knowledge but also assess your ability to apply theoretical concepts to educational data, evaluate classroom-level effects, and generate insights that can influence teaching practices and student outcomes. Each scenario may require a different type of analysis, but most share a common structure:
- Preliminary Descriptive Analyses and Data Checks
- Conducting the Statistical Analysis
- Evaluating Significance and Meaningfulness
- Drawing Conclusions and Writing APA-Style Reports
Let us delve into each component and the theory behind them.
1. Preliminary Descriptive Analyses and Data Checks
The foundation of any educational statistical analysis lies in the initial data exploration phase. This involves computing basic descriptive statistics such as means, medians, and standard deviations, and creating visualizations like histograms and boxplots to examine distributions and identify outliers. It also includes checking for missing values, verifying assumptions of normality, and identifying possible coding errors. These steps ensure the integrity of the dataset and determine whether it is suitable for inferential statistical procedures. Without thorough preliminary analysis, any subsequent findings may be questionable or misleading, affecting the validity of educational recommendations derived from the data. Before conducting any inferential statistics, the first step is understanding the data. This involves:
- Descriptive statistics: Calculating measures of central tendency (mean, median, mode) and variability (standard deviation, range).
- Data visualization: Boxplots, histograms, and scatterplots can reveal distributions, outliers, and patterns.
- Missing data: Identifying and addressing missing values using imputation or listwise/pairwise deletion, depending on the assumption of missingness (MCAR, MAR, MNAR).
- Normality checks: Using skewness, kurtosis, or visual tools like Q-Q plots to evaluate distributional assumptions.
Theoretical Insight: Inferential statistics are built on assumptions, such as independence, normality, and homoscedasticity. If these assumptions are violated, conclusions drawn may be invalid. Thus, data screening is essential to uphold the validity of subsequent analyses.
2. Conducting the Statistical Analysis
Once data checks are complete, the appropriate statistical tests are selected based on the research questions and data types. Common methods include ANOVA for group comparisons, regression for predicting student outcomes, and mixed-effects models to handle nested educational data. The focus here is on choosing the correct model, understanding the assumptions it relies on, and interpreting the output beyond just statistical significance. This step demands a strong theoretical grounding, as educational data often involve multiple variables and interactions that must be carefully modeled to uncover meaningful insights about teaching effectiveness and student performance trends. Each research question demands a specific statistical technique. Let’s explore common ones applicable in educational statistics.
a) Testing Data Reliability for Inferential Use
Reliability refers to the consistency of a dataset. In a longitudinal assessment context, one may compute internal consistency using Cronbach’s Alpha. Additionally, variance and repeated patterns in score distributions can inform reliability.
Equation Example:

Where:
- N= number of items
- cˉ = average inter-item covariance
- vˉ = average variance
b) Testing Random Assignment
Random assignment of students to groups (e.g., classrooms) can be tested using ANOVA for continuous baseline variables. If significant differences exist among groups before treatment, true randomization is questionable.
Theoretical Insight: The null hypothesis in ANOVA posits that group means are equal. If p-value < 0.05, we reject the null, implying groups differ significantly — which should not happen under random assignment.
c) Exploring the Relationship Between Anxiety and Achievement
To examine the association between math anxiety and student performance:
- Correlation analysis quantifies linear relationships.
- Multiple regression allows us to control for confounders (e.g., teacher, prior performance).
Equation Example:
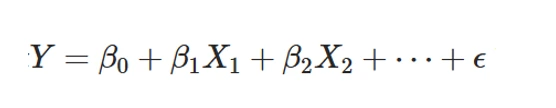
Where:
- Y: student achievement
- X1: math anxiety
- X2: classroom/teacher effect
d) Measuring Teacher Effectiveness
To evaluate if one teacher's students improved more than others over time, we might apply:
- Repeated Measures ANOVA: tests changes across multiple time points within students.
- Mixed-effects models: account for both fixed effects (e.g., teacher) and random effects (e.g., students).
Theoretical Insight: Such models consider the hierarchical structure of educational data — students nested within teachers. Ignoring this nesting may lead to biased results due to intra-class correlation.
3. Evaluating Significance and Meaningfulness
Statistical significance alone does not confirm the importance of findings. Evaluating educational outcomes requires looking at effect sizes, confidence intervals, and practical significance. Measures like Cohen’s d or r² help determine the real-world impact of results, such as how strongly math anxiety correlates with test performance. Additionally, validity and reliability assessments ensure that conclusions are built on sound data. Cross-validation and replication techniques further strengthen results by confirming they are not sample-specific. This stage helps analysts draw conclusions that are not only statistically defensible but also meaningful in the context of improving educational practices.
Statistical Significance
Typically assessed using p-values (<0.05 is often used as the threshold), statistical significance tells us whether an effect is likely due to chance. However, p-values depend on sample size and may not reflect the real-world importance of findings.
Practical Significance
Effect sizes (e.g., Cohen's d, r2r2, eta-squared) offer a scale-free measure of the magnitude of an effect:
- Cohen’s d: Small (0.2), Medium (0.5), Large (0.8)
- r2: Indicates the proportion of variance explained by the model.
Theoretical Insight: While p-values indicate if an effect exists, effect sizes tell us how much that effect matters. Both are essential.
Validity and Reliability Checks
- Construct validity: Does the test measure what it claims?
- Criterion validity: Do scores predict future performance?
- Reliability indices: Internal consistency (e.g., Cronbach’s alpha) and test-retest reliability are critical.
Cross-validation
To confirm the robustness of findings, one may split the dataset and test models on separate halves. Alternatively, k-fold cross-validation can be used.
Theoretical Insight: Cross-validation guards against overfitting, ensuring findings generalize beyond the sample.
4. Writing APA-Style Conclusions for Clients
Communicating findings clearly is crucial, especially when the audience includes school administrators or policymakers. An APA-style report typically includes a well-structured introduction, detailed method section, concise presentation of results, and a thoughtful discussion with actionable insights. The write-up should translate complex statistical concepts into accessible language while maintaining scientific rigor. It must highlight key findings, acknowledge limitations, and recommend practical steps based on the data. A well-written conclusion helps bridge the gap between statistical output and decision-making, ensuring that results are used responsibly and effectively in real educational environments. Educational stakeholders require insights that are both scientifically sound and easily digestible. An APA-style write-up includes:
- Introduction: Define the research question and context.
- Method: Describe data sources, sample, and statistical tests.
- Results: Report test statistics, p-values, confidence intervals, and effect sizes.
- Discussion: Interpret the findings, limitations, and practical recommendations.
Theoretical Insight: Effective communication of statistical findings requires translating complex results into actionable insights. Avoid jargon and emphasize what the data suggests in real-world terms.
Special Considerations in Educational Statistics
Educational data often involve hierarchical structures, such as students within classrooms or schools, which require multilevel modeling techniques to avoid biased results. Small sample sizes are another challenge, as they can reduce statistical power and the generalizability of findings. Ethical considerations also play a major role—analysts must ensure privacy, avoid misinterpretation of data, and use results to support equitable outcomes. Moreover, the high stakes associated with student assessment and teacher evaluation necessitate a cautious and principled approach. Recognizing these special considerations is essential for producing credible and ethically responsible statistical analyses in education.
Hierarchical Data
Educational data often have a multilevel structure: students within classes, classes within schools. This nested structure requires statistical models that account for dependencies.
Small Sample Sizes
Educational studies, especially classroom-based ones, may have small sample sizes. This increases the risk of Type II errors and reduces generalizability.
Ethical Use of Data
Statistical results can influence high-stakes decisions (e.g., awarding teachers, tracking students). It is crucial to report findings transparently and consider the ethical implications of recommendations.
Benefits and Challenges of Educational Data Evaluation
Evaluating educational data provides critical insights that can drive improvements in teaching quality, student achievement, and curriculum design. It helps identify patterns, address learning gaps, and inform resource allocation. However, the process also presents challenges, including data inconsistencies, limited access to comprehensive datasets, and the complexity of measuring intangible factors like motivation or anxiety. Additionally, drawing valid conclusions often requires sophisticated statistical techniques and careful interpretation. Despite these obstacles, the benefits far outweigh the challenges, as data-driven decision-making is essential for creating effective and inclusive learning environments.
Benefits:
- Improved Teaching: Identifies effective educators.
- Student Support: Helps allocate resources where needed.
- Policy Guidance: Informs educational strategies and reforms.
Challenges:
- Data Quality: Missing or inconsistent data can bias outcomes.
- Causal Inference: Observational data limits strong causal claims.
- Privacy: Protecting student identities is paramount.
Purpose: The primary goal is continuous improvement. Statistical evaluations are not about ranking individuals but enhancing learning outcomes.
Conclusion
Educational statistics assignments grounded in real-world data challenge students to blend theoretical knowledge with practical application. By approaching such tasks systematically—starting from data screening to APA-style reporting—students can develop the analytical mindset required for data-driven educational decision-making. This blog outlines a general framework, richly informed by core statistical theory, to help students navigate these assignments. While tools like SPSS or R assist with computation, it's the theoretical reasoning behind each decision that truly distinguishes excellent analysis. Armed with this theoretical grounding, students are well-prepared to tackle any assignment involving educational data design and analysis—not just for a grade, but to make meaningful contributions to the field of education.