How to Approach Hypothesis Testing and Data Analysis Using SAS
Claim Your Discount Today
Get 10% off on all Statistics Homework at statisticshomeworkhelp.com! This Spring Semester, use code SHHR10OFF to save on assignments like Probability, Regression Analysis, and Hypothesis Testing. Our experts provide accurate solutions with timely delivery to help you excel. Don’t miss out—this limited-time offer won’t last forever. Claim your discount today!
We Accept


- 1. Understanding the Problem and Data Structure
- Identify Key Variables and Study Design
- Action Steps:
- 2. Exploratory Data Analysis (EDA)
- Numerical Summaries
- Interpretation Tips:
- Graphical Summaries
- 3. Evaluating Assumptions
- Normality Checks
- Equal Variance Checks
- Decision Framework:
- 4. Selecting the Appropriate Test
- Common Tests in Assignments
- 5. Interpreting Results and Drawing Conclusions
- Key Elements of Reporting
- Handling Non-Significant Results
- 6. Structuring Your Answer
- 7. Common Pitfalls and Tips
- Conclusion
Statistical assignments require a structured approach to data analysis, blending exploratory techniques, assumption validation, and hypothesis testing to derive meaningful conclusions. Whether analyzing noise levels in aircraft or comparing soil pH changes, students must navigate complex datasets with precision. Statistics homework help provides essential guidance in understanding research design, identifying key variables, and selecting the right statistical tests. A strong foundation in statistical methods ensures accurate interpretations and well-supported conclusions. From using graphical tools like boxplots and histograms to performing normality checks and variance assessments, mastering these steps is crucial for academic success. Additionally, handling software such as SAS efficiently can enhance the analysis process, making it easier to execute procedures like PROC MEANS or PROC UNIVARIATE for numerical summaries. Many students seek help with SAS homework to properly structure their statistical reports, ensuring clarity and precision in their findings. By following a systematic workflow—starting with data exploration, evaluating assumptions, selecting appropriate tests, and effectively interpreting results—students can confidently approach any statistical problem. Understanding the differences between paired and independent data, knowing when to apply parametric or nonparametric tests, and interpreting p-values in context are all critical components of a well-structured analysis. Statistical assignments are not just about computation but about transforming raw data into actionable insights. Ensuring accuracy in reporting through well-labeled graphs, clear effect size explanations, and logically structured conclusions strengthens the impact of statistical findings. With the right strategies, students can efficiently analyze datasets, validate assumptions, and make data-driven conclusions that align with real-world applications. Seeking guidance through statistics homework help can bridge knowledge gaps, helping students gain confidence in their analytical abilities and improve their performance in complex statistical coursework.
1. Understanding the Problem and Data Structure

A solid statistical analysis begins with a clear understanding of the research question, study design, and data structure. Identifying key variables—whether they are categorical, continuous, paired, or independent—guides the choice of statistical tests. Recognizing whether the study is observational or experimental further refines the analysis. For instance, comparing noise levels in different aircraft types involves independent groups, requiring tests like the t-test or ANOVA, whereas analyzing pre- and post-treatment effects in a medical study involves paired data, necessitating a paired t-test or Wilcoxon signed-rank test. Every statistical analysis begins with a clear grasp of the research question and data.
Identify Key Variables and Study Design
- Example from Q1: Comparing noise levels (DB) between narrow-body (nb) and wide-body (wb) jets involves two independent groups.
- Example from Q3: Soil pH measurements before and after mall destruction represent paired data.
Action Steps:
- Classify variables as continuous, categorical, paired, or independent.
- Determine if the study is observational (Q1, Q4) or experimental (Q2, Q3).
This classification guides test selection. For instance, paired data (Q3) requires a paired t-test or Wilcoxon signed-rank test, while independent groups (Q1, Q4) use independent t-tests or ANOVA.
2. Exploratory Data Analysis (EDA)
EDA is crucial for uncovering data patterns, identifying outliers, and checking assumptions before performing hypothesis testing. Numerical summaries, such as mean, median, standard deviation, and range, provide an initial understanding of data distribution. Graphical tools like histograms assess normality, while boxplots compare medians and variability across groups. These visual and numerical insights help determine whether parametric or nonparametric methods are appropriate for further analysis. EDA reveals distribution patterns, outliers, and potential assumptions.
Numerical Summaries
Use SAS procedures like PROC MEANS or PROC UNIVARIATE to calculate:
- Measures of Center: Mean, Median.
- Measures of Spread: Standard deviation, range, quartiles.
Interpretation Tips:
- In Q1, a higher mean DB for narrow-body jets compared to wide-body jets suggests a potential difference.
- Overlapping quartiles (visible in boxplots) might indicate variability that undermines significance.
Graphical Summaries
- Boxplots (PROC SGPANEL): Compare medians, spread, and outliers across groups. For Q1, side-by-side boxplots visually reinforce numerical summaries.
- Histograms (PROC UNIVARIATE): Assess normality. Skewed distributions (Q4’s femur strength data) may violate parametric assumptions.
Key Insight: Graphical and numerical outputs should align. For example, skewed histograms correspond to large mean-median gaps.
3. Evaluating Assumptions
Statistical tests rely on certain assumptions, primarily normality and equal variance, to ensure validity. Normality can be assessed through histograms, Q-Q plots, or statistical tests like Shapiro-Wilk. Levene’s test evaluates variance equality for parametric tests like ANOVA. If these assumptions are violated, alternatives such as transformations or nonparametric methods (e.g., Wilcoxon or Kruskal-Wallis tests) should be considered to maintain accuracy. Parametric tests (t-tests, ANOVA) require normality and equal variances. Nonparametric tests (Wilcoxon, Kruskal-Wallis) relax these assumptions.
Normality Checks
- Graphical: Histograms, Q-Q plots.
- Statistical: Shapiro-Wilk test (not always necessary; visuals often suffice).
Example: Q4’s boxplots for femur strength might show non-normal distributions (e.g., skewed UF group), favoring a nonparametric Kruskal-Wallis test.
Equal Variance Checks
- Levene’s Test: For ANOVA/t-tests.
- Boxplot Spreads: Similar IQRs across groups (Q1) support equal variances.
Decision Framework:
- If assumptions hold → Parametric test.
- If violated → Nonparametric test or transformation.
4. Selecting the Appropriate Test
Choosing the right statistical test depends on study design, variable type, and assumption validation. Independent t-tests compare two groups, while paired t-tests analyze repeated measures. For nonparametric alternatives, Mann-Whitney U or Wilcoxon tests handle skewed data. ANOVA compares means across multiple groups, whereas regression models explore relationships between variables. Selecting an appropriate test ensures robust statistical inference. Align the test with the study design and assumptions.
Common Tests in Assignments
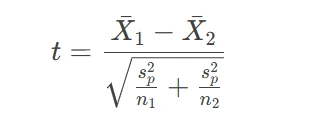
- Independent t-test (Q1): Compare means of two independent groups.
- Assumptions: Normality, equal variance.
- Formula:
- Where sp2 is the pooled variance.
- Paired t-test (Q3): Compare pre-post measurements.
- Wilcoxon Rank-Sum/Mann-Whitney U (Q1): Nonparametric alternative for independent groups.
- ANOVA (Q4): Compare means across ≥3 groups.
Assumptions: Differences are normally distributed.
Formula:
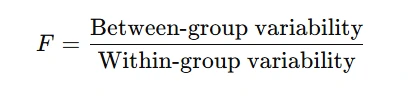
Example: In Q2, blood pressure changes between supplement and placebo groups could use a t-test if assumptions hold or Wilcoxon if skewed.
5. Interpreting Results and Drawing Conclusions
Accurate interpretation of statistical results requires considering p-values, effect sizes, and confidence intervals. A p-value below 0.05 typically indicates statistical significance, but practical relevance should also be assessed through effect size measures. When results are non-significant, sample size limitations, confidence interval overlaps, and variability should be discussed to provide a complete analysis.
Key Elements of Reporting
- P-values: Indicate statistical significance.
- Effect Size: Practical significance (e.g., mean difference in DB levels).
- Context: Relate findings to the research question.
Example for Q1: If the t-test yields p < 0.05, conclude that jet types differ significantly in noise levels. Handling Non-Significant Results
- Discuss sample size (e.g., Q2’s n=10 vs. n=11 may limit power).
- Consider confidence intervals overlapping with no effect (e.g., Q3’s soil pH changes).
6. Structuring Your Answer
A well-structured answer balances clarity and completeness, following a logical sequence of problem definition, analysis, and conclusions. The main section should summarize key findings, while detailed assumption checks, raw data outputs, and graphical representations can be placed in an appendix. This approach ensures that responses remain concise while including necessary details. Follow the syllabus guidelines to balance brevity and completeness:
- Main Answer: Summarize key findings (e.g., “Boxplots show wider spread for nb jets”).
- Appendix: Place assumption checks (Q2, Q3), raw outputs, and detailed graphs.
Example: In Q3a, briefly state the paired design in the main text but evaluate normality in the appendix.
7. Common Pitfalls and Tips
Students often struggle with misidentifying paired versus independent data, neglecting assumption checks, and relying solely on p-values without considering effect sizes. Overlooking graphical summaries can also weaken analysis clarity. To avoid these pitfalls, always validate assumptions, complement numerical findings with visual tools, and ensure logical coherence in reporting statistical results.
- Misidentifying Paired vs. Independent Data:
- Overlooking Assumptions:
- Overreliance on p-values:
- Graphical Neglect:
Paired data (Q3) has matched observations; independent data (Q1) does not.
Always validate normality and variance before choosing parametric tests.
Supplement with effect sizes and confidence intervals.
A well-labeled boxplot (Q1b) can outweigh paragraphs of text.
Conclusion
Tackling statistical assignments demands a systematic approach: understand the design, explore the data, validate assumptions, and select tests accordingly. By mastering these steps—and articulating your reasoning clearly—you can transform raw data into compelling scientific narratives. Whether comparing jet noise levels or bone strength across age groups, the principles remain universal: let the data guide your analysis, and let logic shape your conclusions.