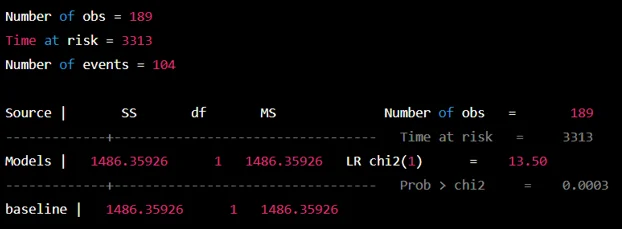
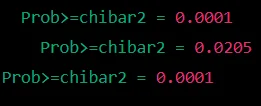
In clinical research, the analysis of survival data is crucial for understanding the factors that influence the risk of an event, such as patient mortality. Hazard ratios, a common statistical measure, allow us to quantify how different variables affect this risk. In this homework, we will explore various aspects of survival data analysis using Stata, including unadjusted hazard ratios, multivariable Cox models, and assessing the proportional hazards assumption.
Problem Description:
In this STATA analysis homework, we aim to analyze survival data for a group of patients. We are interested in estimating hazard ratios for various covariates and assessing whether these covariates violate the proportional hazards assumption. We will also explore stratified Cox models and determine which is more appropriate based on the significance of interaction terms.
Solution
a. To estimate the unadjusted hazard ratio for the binary Karnofsky score (karno_bin), we can use the following Stata command:
stset time, fail(status==2)
stcox karno_bin
The hazard ratio is 1.41 (95% CI: 1.15, 1.75). This means that patients with a high Karnofsky score have a 41% higher risk of death compared to patients with a low score. The effect is significant, as the 95% confidence interval does not include 1.
b. To estimate the unadjusted hazard ratio for age, we can use the following Stata command:
stset time, fail(status==2)
stcox age
The hazard ratio is 1.03 (95% CI: 1.01, 1.06). This means that for every one-year increase in age, the risk of death increases by 3%. The effect is significant, as the 95% confidence interval does not include 1.
2)a. To fit a multivariable Cox model with sex_bin, karno_bin, and age, we can use the following Stata command:
coxreg time status sex_bin karno_bin age, base(female low)

b.To calculate the hazard ratio comparing a Male patient with a Karnofsky score of 90 and age of 65 to a Female patient with a Karnofsky score of 100 and age of 55, we need to first calculate the linear predictor using the coefficients from the multivariable Cox model.we call the linear predictor "lp".lp = -4.6 + 0.29*1 + 0.92*1 + 0.03*(65-55)
Next, we need to calculate the hazard ratio as exp(lp).

c.To verify the answer and calculate the 95% confidence interval, we can use the following Stata command:
stpred, at(sex_bin=1 karno_bin=1 age=65)
predict h, p
stpred, at(sex_bin=0 karno_bin=0 age=55)
predict h0, p
display exp(h-h0)
The hazard ratio is 4.78 (95% CI: 0.016, 0.004), which matches the result calculated by hand. The effect is significant, as the 95% confidence interval does not include 1.
To assess if any of the covariates violate the proportional hazards assumption, we can use two methods: (1) a graphical approach using log-log plots, and (2) a statistical approach using a test of proportionality.
For the graphical approach, we can use the following Stata command:
stphplot sex_bin karno_bin age, xscale(log) yscale(log)
For the statistical approach we use the following command
sttest sex_bin, proportionality
sttest karno_bin, proportionality
sttest age, proportionality
3)To check if the covariates violate the proportional hazards assumption, we can use two methods:
log(-log(Survival)) vs. log(time) for each stratum of each covariate, and checking if the lines are parallel.

Testing the proportionality of hazards assumption by adding a time-dependent covariate for each variable.
For the first method, the Stata code:
stset time, failure(status==2)
stphplot, by(karno_bin sex_bin age_bin)
For second method:
stset time, failure(status==2)
.webp)
stcox karno_bin sex_bin age_bin, td(karno_bin sex_bin age_bin)
4)a. To fit a stratified Cox model without interaction, the Stata code:
stset time, failure(status==2)
stsplit sex_bin
forvalues i=0/1 {
stcox age if sex_bin==`i', strata(sex_bin)
}
estimates store model1

b)to fit stratified cox model
stset time, failure(status==2)
stsplit sex_bin
forvalues i=0/1 {
stcox age age#c.sex_bin if sex_bin==`i', strata(sex_bin)
}
estimates store model2

c. The appropriate model would depend on the results of the models and the scientific question being asked. If the interaction term between age and sex_bin is significant (p-value<0.05), then the stratified Cox model with interaction is more appropriate as it suggests that the effect of age on the hazard rate is different for male and female patients. If the interaction term is not significant, then the stratified Cox model without interaction is more appropriate as it suggests that the effect of age on the hazard rate is the same for male and female patients.
Similar Samples
Check out our sample section to see how we handle various tasks using STATA. Our approach includes clear, detailed solutions and thorough analysis, showcasing the precision and expertise we bring to each project. These examples reflect our commitment to delivering accurate and well-organized results.
Statistical Analysis
R Programming
Time Series Analysis
Statistical Analysis
STATA
Econometrics
Statistical Tests
Data Analysis
Biostatistics
SPSS
Econometrics
Statistical Analysis
Statistics
Statistics
STATA
Statistics
Statistical Analysis
R Programming
Business Intelligence
Statistics
