Median and Multiple Regression Calculation
For written assignments, you will need to attach three files:
Word Document (with responses to the SPSS questions).
SPSS syntax file (to show the procedures you used in the analysis)
SPSS output file (to show the output you are using in your analysis)
1. Chicago description
a. What is the range of median income for the 77 community areas (using the variable MEDINC)?
The range of median income for the 77 community areas is 102238.4737
b. What is the range of median age for the 77 community areas (using the variable MED_AGE)?
The range of median age for the 77 community areas is 27.509
c. What is the average rate of offense deceptive practices in the 77 community areas per 100,000 population? (using the variables DECEPTIVETOT and TOT_POP to calculate the rate)
DECEP_AVG = DECEPTIVETOT*100000/TOT_POP
Average of offense deceptive practices = Average of DECEP_AVG = 669.7487 per 100,000 population
d. What is the mean percentage of college-educated persons in the community areas? (use the variables SOME_COLL, ASSOC, BACH, and GRAD_PROF) along with the variable TOT_POP to calculate this percentage).
COL_PERC = SUM of SOME_COLL, ASSOC, BACH, and GRAD_PROF / TOT_POP
Mean percentage of college educated persons = Mean of FOR_PERC = 39.94%.
e. What is the maximum percentage of foreign-born individuals in a community area? (Use the variables FOR_BORN and TOT_POP to calculate this percentage).
FOR_PERC = FOR_BORN/TOT_POP
Max percentage of foreign-born individuals in a community area = MAX of FOR_PERC = 59%
2. Chicago multiple regression
Construct a multiple regression model to consider the relationship between the rate of the crime of deceptive practices and the variables median income, median age, percent of college-educated persons, and percent of foreign-born in a community area.
a) What is the dependent variable in your analysis? What are the independent variables in your analysis?
The rate of crime of deceptive practices is the dependent variable. The independent variables are median income, median age, percent of college-educated persons, and percent of foreign-born in a community area.
b) What statistic did you consider Is the overall model statistically significant? What statistic do you use to determine the overall significance of the model?
The F-statistic indicates the overall model’s statistical significance. The F-statistic is equal to 16.365, p-value < 0.001. At 0.05 significance level, the model is statistically significant
c) Of the independent variables, which ones are statistically significant?
All four independent variables are statistically significant.
d) Of the independent variables, indicate the direction of the relationship and your conclusion about what factors are associated with the rate of the crime of deceptive practices?
Median income and foreign percentage are negatively related to the rate of crime of deceptive practices and college percentage and median age are positively related to the rate of crime of deceptive practices.
e) What other variables would you like to add to the analysis, explain why these might be important?
We could add EMP variable to the analysis as we would like to analyze the impact of employment percentage on the rate of crime of deceptive practices.
3. Recidivism Descriptive Analysis. Use the data file BUCJ591DATA10AIOWARECIDIVISM.SAV and the following variables:
IOWAGROUP - designates whether the person was released from prison or supervised by probation.
RECIDIVISMBASEYEAR – the year released from prison or placed on probation.
RECIDIVISMREPORTINGYEAR – three years after the base year, the follow-up period.
RETURNTOPRISON – designates whether the individual was returned to prison during the three-year follow-up period. This is the recidivism definition.
SEX – designates males and females.
OFFENSETYPE – designates the type of offense (e.g., drug, property, violent, etc.)
a) What is the recidivism rate for the entire sample?
The recidivism rate for the entire sample is 16%
b) What is the recidivism rate of those released from prison compared to probationers?
The recidivism rate of those on probation is 11.3% and for those released from prison is 33.4%.
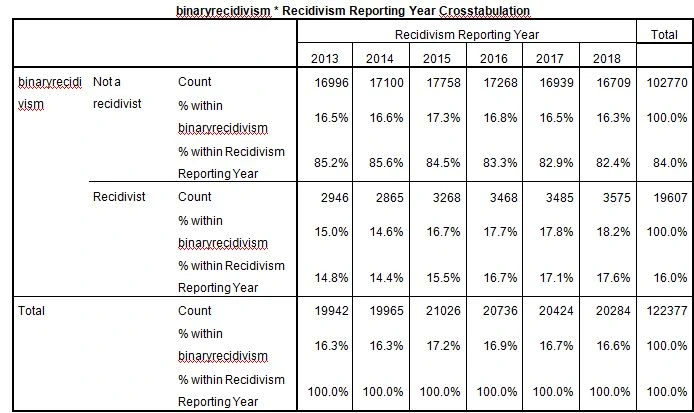
c) What is the recidivism rate for each of the years in the sample?

The recidivism rate has increased over the years, rising from 14.8% in 2013 to 17.6% in 2018
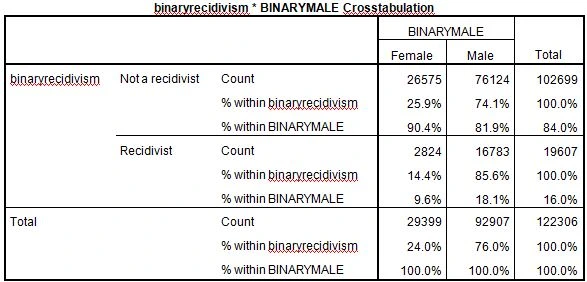
d) What is the recidivism rate of males compared to females?

The recidivism rate for men is 18.1% compared to 9.6% for women.
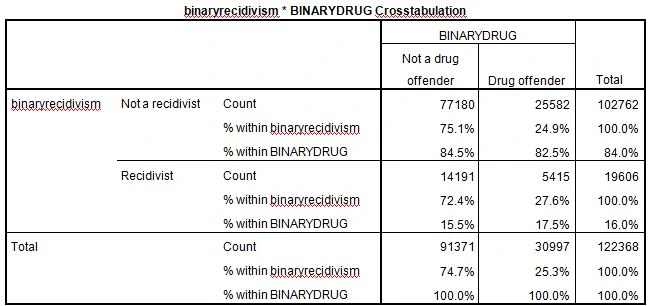
e) What is the recidivism rate of drug offenders, violent offenders, and property offenders?

The recidivism rate for drug offenders is 17.5% compared to 15.5% for non-drug offenders.
4. Recidivism Binary logistic regression analysis. Using the data file BUCJ591DATA10AIOWARECIDIVISM.SAV and the following variables construct a binary logistic regression model to test which variables are related to recidivism outcomes:
BINARYRECIDIVISM – 0 is non-recidivist and 1 is recidivist
BINARYMALE – 0 is female and 1 is male
BINARYPRISON – 0 is a probationer and 1 is a prison release
BINARYRACE – 0 is non-white and 1 is white
BINARYFELONY – 0 is misdemeanor and 1 is a felony
BINARYDRUG – 0 is other offense and 1 is drug offender
a) What is the dependent variable in the model? What are the independent variables in the model?
The dependent variable is BINARYRECIDIVISM. The independent variables are BINARYMALE, BINARYPRISON, BINARYRACE, BINARYFELONY, and BINARYDRUG.
b) Is the overall model statistically significant? What statistic do you use to determine the overall significance of the model?
The overall model’s statistical significance can be determined by Nagerkelke’s R-square, which is equal to 0.128 for this model. The overall model is statistically significant.
c) Of the independent variables, which ones are statistically significant?
All the independent variables are statistically significant.
d) Of the independent variables, indicate the direction of the relationship and your conclusion about what factors are associated with recidivism risk?
BINARYMALE, BINARYPRISON, BINARYFELONY are positively linked with recidivism, and BINARYRACE, BINARYDRUG is negatively linked with recidivism.
e) What other variables would you like to add to the analysis, explain why these might be important?
We would like to add Recidivism Reporting Year to check if the recidivism rates have changed over the years.
Similar Samples
SPSS
Statistics
Statistics
Statistics
Statistics
SPSS
SPSS
SPSS
Statistics
Statistics
Statistics
Statistics
SPSS
Statistics
SPSS
SPSS
SPSS
Statistics
SPSS
SPSS
