In this sample homework solution, our experts use STATA to analyze a dataset that provides information about mothers and their children. It involves exploring the data and extracting key insights, which we present in a clear and visually appealing manner. From scatter plots to revealing statistics, our analysis paints a vivid picture of the dataset, shedding light on maternal relationships and sibling dynamics.
Problem Statement:
You are provided with a dataset containing information about mothers and their children. In this data analysis using STATA homework you are tasked with extracting valuable insights from the data. The goal is to answer several questions and present your findings in a visually appealing manner.
Solution
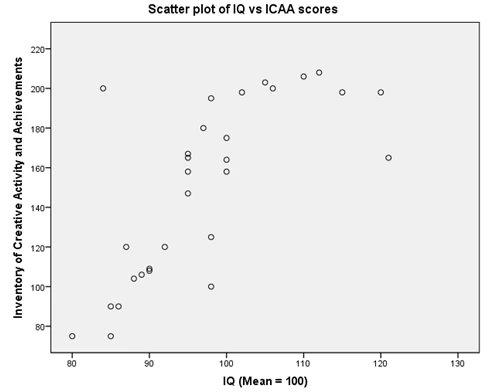
Answer 2:Scatter plot

Answer 3: 205 mothers have at least one daughter
distinct count_mother if sex==2
| Information | Total | Distinct |
|---|---|---|
| count_mother | 329 | 205 |
Answer 4:127 mothers have exactly one daughter
distinct motherID if femalecount==1
| INFORMATION | TOTAL | DISTINCT |
| motherID | 127 | 127 |
Answer 5:140 girls are the oldest child
tab old_sib_girl
| Old_Sib_girl | Freq. | Percent | Cum. |
| 1 | 140 | 100.00 | 100.00 |
| Total | 140 | 100.00 |
Answer 6:205 girls are the oldest daughter.
distinct motherID if femalecount>=1
| INFORMATION | TOTAL | DISTINCT |
| motherID | 329 | 205 |
Answer 7:25 years is the largest age gap between siblings in the data
tab age_gap
| age_gap | Freq . | Percent | Cum . |
|---|---|---|---|
| 0 | 109 | 15.31 | 15.31 |
| 1 | 8 | 1.12 | 16.43 |
| 2 | 14 | 1.97 | 18.4 |
| 3 | 33 | 4.63 | 23.03 |
| 4 | 33 | 4.63 | 27.67 |
| 5 | 51 | 7.16 | 34.83 |
| 6 | 64 | 8.99 | 43.82 |
| 7 | 36 | 5.06 | 48.88 |
| 8 | 28 | 3.93 | 52.81 |
| 9 | 43 | 6.04 | 58.85 |
| 10 | 25 | 3.51 | 62.36 |
| 11 | 39 | 5.48 | 67.84 |
| 12 | 32 | 4.49 | 72.33 |
| 13 | 17 | 2.39 | 74.72 |
| 14 | 26 | 3.65 | 78.37 |
| 15 | 24 | 3.37 | 81.74 |
| 16 | 10 | 1.4 | 83.15 |
| 17 | 30 | 4.21 | 87.36 |
| 18 | 6 | 0.84 | 88.2 |
| 19 . | 18 | 2.53 | 90.73 |
| 20 | 4 | 0.56 | 91.29 |
| 21 | 23 | 3.23 | 94.52 |
| 22 | 7 | 0.98 | 95.51 |
| 23 | 7 | 0.98 | 96.49 |
| 24 | 17 | 2.39 | 98.88 |
| 25 | 8 | 1.12 | 100 |
Similar Samples
Explore our sample section to see how we approach and solve various statistics problems using tools like STATA. These samples demonstrate the quality and accuracy of our work, ensuring precise results for your statistical assignments without unnecessary explanations or tutorials. Check them out for a clear overview of our process.
Statistical Analysis
R Programming
Time Series Analysis
Statistical Analysis
STATA
Econometrics
Statistical Tests
Data Analysis
Biostatistics
SPSS
Econometrics
Statistical Analysis
Statistics
Statistics
STATA
Statistics
Statistical Analysis
R Programming
Business Intelligence
Statistics