- Problem Description:
- Solution
- Question 1
- Question 2
- Question 2b
- Question 2c
- Question 2d
- Question 2e
- Question 3a
- Question 3b
- Question 3c
- Question 3d
- Question 3e
In this homework, we explore statistical analysis and probability through a series of questions. Each question is designed to apply statistical concepts and the Central Limit Theorem to solve real-world problems. We provide clear and structured solutions, along with a brief problem description for context, to help you understand and apply these statistical principles effectively. Let's dive into the world of data and probabilities!
Problem Description:
You are given a set of questions related to statistical analysis assignment and probability. Each question requires you to apply the Central Limit Theorem and various statistical methods to find probabilities and percentiles. Below are the solutions to each question.
Solution
Question 1
μ=30
σ=20
n=100
From the Central Limit Theorem, if a sample size is sufficiently large, n≥30, then the sample mean is approximately normally distributed with mean, μ_x ̿ =μ and standard deviation,
σ_x ̿ =σ/√n
Therefore, the sampling distribution of x ̅, has mean μ_x ̿ =30 and standard deviation,
σ_x ̿ =20/√100=2
Question 2
n=150
μ=240
σ=28
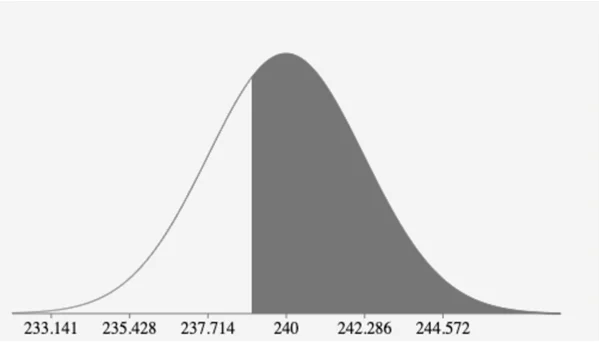
P(x ̿>4)=P(z>(239-240)/(28/√150))
=P(z>(-1)/2.28619)
=P(z>-0.4374)
=1-P(z<-0.4374)
=1-0.3309
=0.6691
Question 2b
38th Percentile of the population
38/100=ϕ((x ̿-240)/(28/√150))
⟹ϕ^(-1) (0.38)=(x-240)/2.28619
⟹-0.305×2.28619=x-240
∴-0.6984=x-240
x=240-0.6984
=239.30
Question 2c
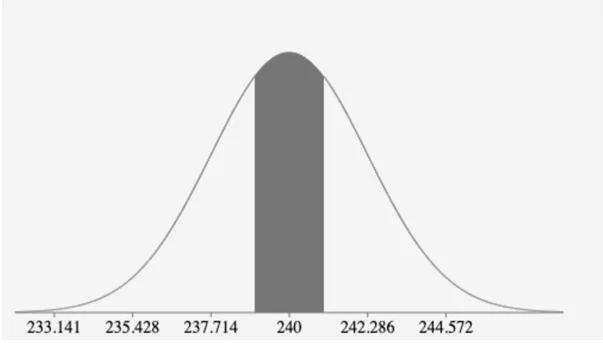
P(239
=P(-0.4374
=P(z<0.4374)-P(z<-0.4374)
=0.6691-0.3309
=0.3382
Question 2d
P(x ̿>242)=P(z>(242-240)/(28/√150))
=P(z>2/2.28619)
=P(z>0.8748)
=1-P(z<0.8748)
=0.1908
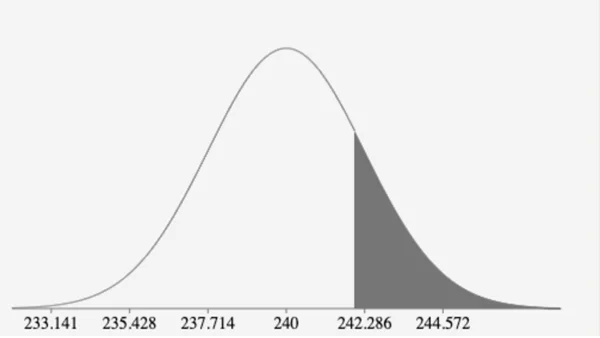
It is not unusual for the sample mean to be more than 242 since the calculated probability = 0.1908 is within the bounds of probability value; 0≤P≤1.
Question 2e
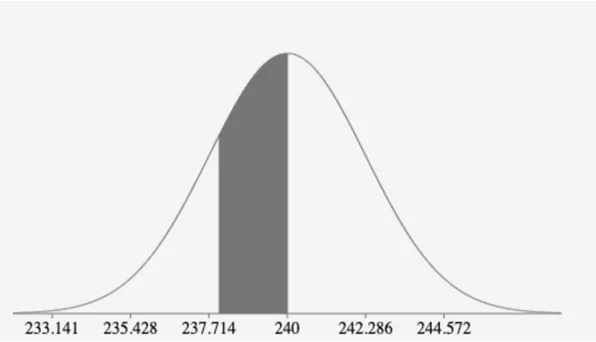
P(238
=P(-0.8748
=P(z<0)-P(z<-0.8748)
=0.5-0.1908
=0.3092
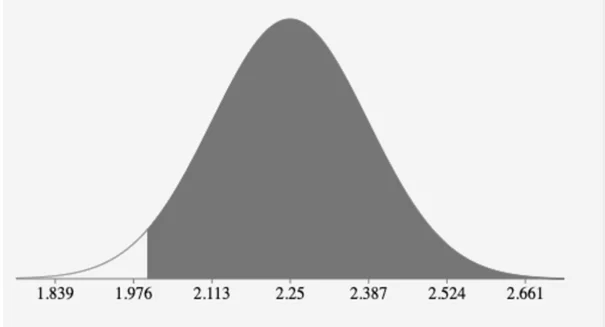
Question 3a
μ=2.25
σ=1.3
n=90
P(x ̿>2)=P(z>(2-2.25)/(1.3/√90))
=P(z>-1.8244)
=1-P(z<-1.8244)
=1-0.034
=0.966
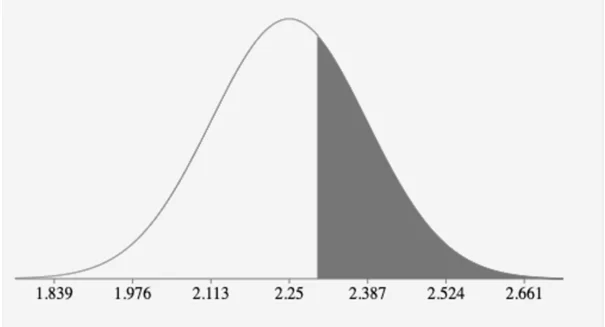
Question 3b
P(2.3
=P(0.3649
=P(z<6.9327)-P(z<0.3649)
=0.3576
Question 3c
20th Percentile of the population
20/100=ϕ((x ̿-2.25)/(1.3/√90))
⟹ϕ^(-1) (0.2)=(x-2.25)/0.1370
⟹-0.8416×0.1370=x-2.25
∴x=2.25-0.08870
=2.16
Question 3d
P(x ̿<2)=P(z<(2-2.25)/(1.3/√90))
=P(z<-1.8244)
=0.034
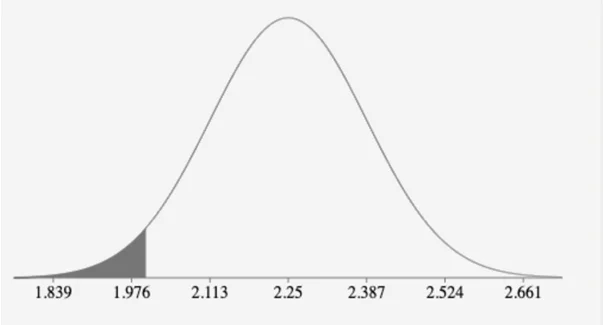
It would not be unusual for the sample mean to be less than 2 since the calculated probability =0.034 is within the bounds of probability value; 0≤P≤1.
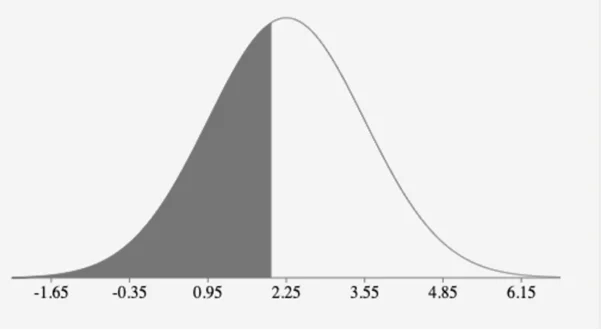
Question 3e
P(x<2)=P(z<(2-2.25)/1.3)
=P(z<-0.1923)
=P(-0.1923)
=0.4238
Similar Samples
In our sample section, you’ll find diverse solutions that demonstrate our approach to statistical problems, including probability analyses. Each example illustrates the methodologies we employ to provide accurate, detailed answers, showcasing our commitment to delivering high-quality homework solutions tailored to meet specific requirements.
Statistical Analysis
R Programming
Time Series Analysis
Statistical Analysis
STATA
Econometrics
Statistical Tests
Data Analysis
Biostatistics
SPSS
Econometrics
Statistical Analysis
Statistics
Statistics
STATA
Statistics
Statistical Analysis
R Programming
Business Intelligence
Statistics
