In this comprehensive SPSS analysis, we delve into the historical disparities in survival probabilities among individuals buried in St. Mary's Catholic Cemetery and Alexandria Contraband and Freedman's Cemetery. This assignment uncovers intriguing insights into the life expectancies of distinct groups, shedding light on the challenges and historical context that influenced their survival rates during the Emancipation and Reconstruction era.
Problem Description:
The SPSS analysis homework at hand involves an in-depth analysis of survival probabilities across the lifespan of individuals buried in two distinct cemeteries, St. Mary's Catholic Cemetery and Alexandria Contraband and Freedman's Cemetery. The objective is to determine the factors that contribute to differences in survival probabilities between these two groups, with a particular focus on the historical context of the Emancipation and Reconstruction era in the United States.
Solution
Part I

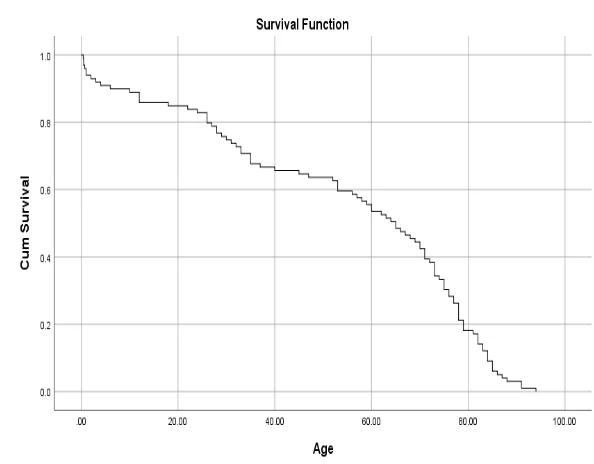
The survival curve above represents the probability of survival across the lifespan in a sample of individuals drawn from the St. Mary’s Catholic Cemetery. The probability of survival is highest at the earliest stage of life. As soon the age increases, the chance of survival diminishes. Between 1 and four 4 years of age, the chance of survival is very high which is more than 0.9, as one progresses towards 20 to 40 years, the probability reduces to 0.65, as soon as one goes beyond 70 years, the chance of survival becomes so low and at this point, the number of individuals still surviving in this cohort is very small as much proportion (70%) of the individual could not survive.
Part II
Overall Comparisons
| Rank | Chi-Square | df | Sig. |
| Log Rank (Mantel-Cox) | 61.537 | 1 | .000 |
Overall Comparisons Chi-Square df Sig. Log Rank (Mantel-Cox) 61.537 1 .000 Test of equality of survival distributions for the different levels of CemetaryCOV.
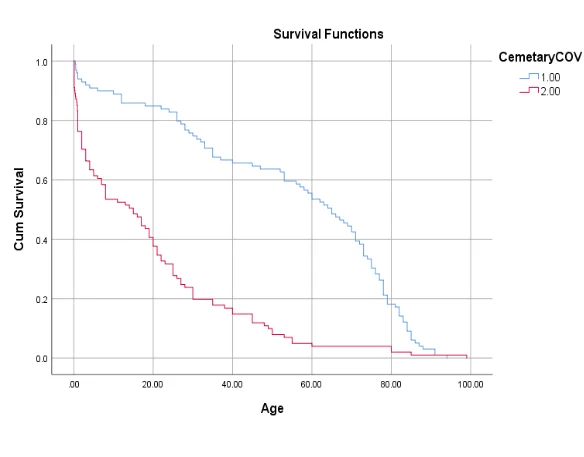
Form the table of overall comparisons is presented above, the differences in survival probability between the two groups were examined using Log Rank test. The null hypothesis of this test is that there is no difference in survival probability between the two groups. From the test result, we have sufficient evidence to reject the null hypothesis since the p-value (0.000) is less than the significance level (0.05) and conclude that the survival probability between the two groups are significantly different from one another. In particular, the survival probability for individuals in Saint Mary’s cemetery is significantly higher than those in Alexandria Contraband and Freedman’s cemetery.

The survival curve above shows the survival probability between the two groups. The difference in the survival probability in the curve is validated by the log rank test discussed earlier. The difference is clearly shown on the plot above. This is actually expected because the black Americans were enslaved even though many of them were freed under the Emancipation Proclamation. Most of them had short lifespan than the non-black Americans due to the stress of slavery. Also, there will be preferential treatment for non-black Americans and this will lead to exposure to avoidable hazard due to racism.
Part III
Variables in the Equation
| Survival | B | SE | Wald | df | Sig. | Exp(B) | Lower | Upper |
|---|---|---|---|---|---|---|---|---|
| CemetaryCOV | 1.136 | .153 | 55.186 | 1 | .000 | 3.113 | 2.307 | 4.200 |
The results of the model is presented in the above table, the result reveal that the hazard ratio in age at death for individual in Alexandria Contraband and Freedman’s cemetery is 3.113 times the hazard ratio for Saint Mary’s cemetery. Since p-value associated with the test statistic is less than the significance level, we reject the null hypothesis and conclude that risk of mortality differed between the two groups.
During the Emancipation and Reconstruction era, African Americans flocked to join the Union army, but were rejected at first for fear of alienating pro-slavery sympathizers in the North and the Border States. Even after joining the army, most of the black Americans were killed in the war front. The act of racism in this era is a significant factor in the low chance survival by the black American.
Similar Samples
Explore our samples to see how we approach statistical problems, including detailed SPSS analyses. These samples demonstrate the steps we take to solve assignments, ensuring clarity and accuracy. Each sample reflects our experts methodical approach to handling various statistical tasks, showcasing precision in data analysis and interpretation.
Statistical Analysis
R Programming
Time Series Analysis
Statistical Analysis
STATA
Econometrics
Statistical Tests
Data Analysis
Biostatistics
SPSS
Econometrics
Statistical Analysis
Statistics
Statistics
STATA
Statistics
Statistical Analysis
R Programming
Business Intelligence
Statistics
