In this assignment, we delve into the world of statistical data analysis, leveraging a dataset characterized by a sample mean (x̅) of 56.04242 and a sample standard deviation (S_x) of 3.312479. Our main objective is to explore the data's distribution, assess its skewness, and calculate the percentage of data points within specific standard deviation intervals. Let's embark on this journey of statistical discovery and visualization.
Problem Description:
In this Statistical Analysis assignment, we are presented with a dataset and asked to perform various analyses on it. We have two key statistical parameters, the sample mean (x̅) and the sample standard deviation (S_x), which are 56.04242 and 3.312479, respectively. The primary objective is to understand the distribution of the data and compute the percentage of data points within certain standard deviation intervals.
Solution

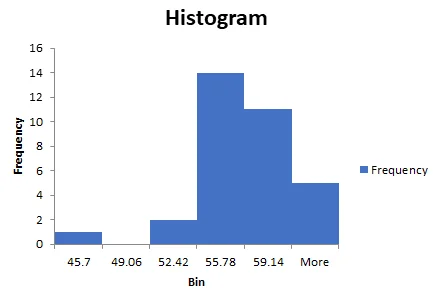
- Histogram

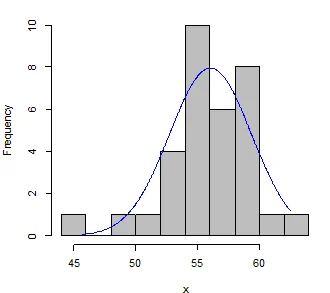
- Histogram with normal curve

The shape of the distribution is not symmetrical. It is skewed to the left.
- One standard deviation interval
Lower 52.72994
Upper 59.3549
- It is 24/33 = 72.72%
- two standard deviation interval
Lower 49.41747
Upper 62.66738
- It is 32/33 = 96.97%
- 68% of data supposed to fall within one standard deviation
- 95% of data supposed to fall within two standard deviation
- 99.7% of data supposed to fall within three standard deviation
Similar Samples
Explore our samples to see how we approach and solve a wide range of statistics homework. From data collection to detailed statistical analysis, our examples demonstrate the precision and accuracy we deliver in every solution. Review them to understand the quality and depth of our work.
Statistical Analysis
R Programming
Time Series Analysis
Statistical Analysis
STATA
Econometrics
Statistical Tests
Data Analysis
Biostatistics
SPSS
Econometrics
Statistical Analysis
Statistics
Statistics
STATA
Statistics
Statistical Analysis
R Programming
Business Intelligence
Statistics
